User Activity Report
In order to best understand how your customers are using your online ordering page, we have created this User Activity Report which helps you understand how many people view your page and what items are most popular.
From our experience it is common for customers to use your online ordering page as a way to review your menu when they are considering takeout options or to use as a guide when they call in to order. Your online ordering menu is often the easiest way for customers to see what you offer, what their options and choices are etc. This report will help you understand the reach of your menu and which items are the most popular so you can plan your marketing and specials.
Report Criteria
To access the User Activity Report, you must be logged in as manager, then select Reports -> User Activity Report from the left menu.
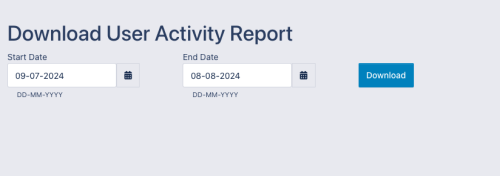
Select the Start and End date that you would like to review and click the download button to download your report. Note the default start and end date will automatically populate to show you the last 30 days activity. You can only select a range that is 90 days or less in duration.
The system will generate and download the report for you that can be opened in Microsoft Excel or any other spreadsheet application.
Example Report and Data
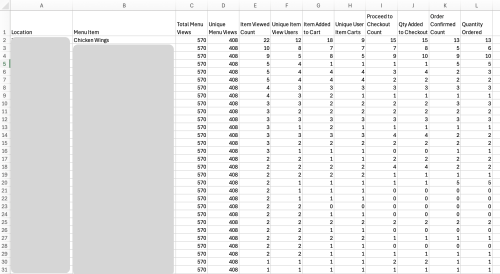
You will now find a list of rows, grouped by location (if you have multiple locations/restaurants that you can access with your login) which provides the following data:
- Location - The restaurant name for these items (will be the same unless you have access to multiple restaurants/locations)
- Menu Item - The name of the menu item for data details
- Total Menu Views - This is the total number of times your menu was viewed during this period (this is the same for every item - it shows overall menu views)
- Unique Menu Views - This is the total number of unique users who viewed your menu during this period (this is the same for every item - it shows overall menu views)
- Item Viewed Count - This is the number of times that this menu item was clicked/opened from the menu page
- Unique Item View Users - This is the number of unique users who viewed this item
- Item Added to Cart - This is the total number of times a user added this item to their cart
- Unique User Item Carts - This is the number of unique users who added this to their cart
- Proceed to Checkout Count - This is the total number of times that this item was in a cart that proceeded to the checkout page
- Qty Added to Checkout - This is the total quantity of this item that were in carts that proceeded to the checkout page
- Order Confirmed Count - This is the total number of confirmed orders where this item was included
- Quantity Ordered - This is the total quantity of this menu item that was confirmed ordered
Interpreting the Report
Here are some important questions that you can pull answers and data from this report for your insights:
Are people using my online ordering page?
From the Total Menu Views and Unique Menu Views you can quickly see how many people are coming to your Dine Niagara ordering page to review your menu. Each one of these views and users has the potential to either turn into an online order, a telephone order, or a visit to your physical restaurant to dine-in.
Am I getting value from having online ordering?
There are times where you will find that the order volume is down through your online menu, but remembering that some of the views/users will be ordering via telephone or dining in, it is important to look at the expected cost of customer acquisition to determine your overall value.
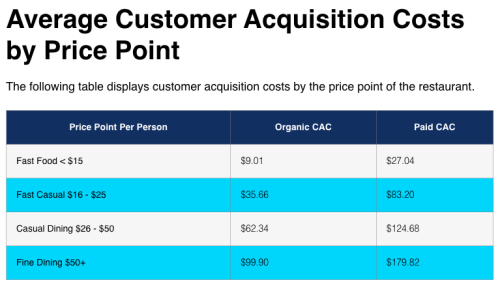
According to a July 2024 study, the average Cost of Acquisition (CAC) in the restaurant industry is as follows:
Note that these are US dollar amounts for acquisition including all channels (social, digital, print, in-store etc) and show the cost you should expect to pay to acquire one new customer.
Based on your overall menu views and unique users, coupled with the order volume, you can determine the value for your restaurant in comparison to the average. For most restaurants who choose Dine Niagara who fall in the Fast Casual or Casual Dining categories you only need to convert 1-2 customers from your monthly investment to sales to beat the industry average conversion cost.
What items should I be promoting?
There are two ways to look at this question:
- Based on customer activity you know which of your items are most popular to look at and you can compare that to the number of orders to see where you have an item which is viewed more often but converts to sales less. This might be an option for a special promotion which can help to increase conversions (assuming that it is a profitable item).
- Based on customer activity you know which of your items are least popular to be viewed and convert. If there are items there which are significantly profitable, you may want to consider offering special offers to drive engagement with those items.
There are likely many other ways to interpret this data in your promotion testing to see what works best in your restaurant.


